Nordson Corporation Fundamental Analysis
Disclaimer: This article by The Globetrotting Investor is general in nature. We aim to bring you long-term focused analysis driven by fundamental data, hence, providing you commentary based on historical data and analyst forecasts only using an unbiased methodology. This is not a buy/ sell recommendation, and it is solely for educational purposes. Please do your research before investing. Note that our analysis may not factor in the latest price-sensitive company announcements or qualitative material. Please read the full disclaimer here.
Nordson Corporation
Last Updated: 5 Jan 2024
NASDAQ: NDSN
GICS Sector: Industrials
Sub-industry: Specialty Industrial Machinery
https://www.nordson.com
Share this fundamental analysis
Table of Contents
You can download a summary of Nordson Corporation's fundamental analysis in PDF here.
Management
CEO: Naga Nagarajan
Tenure: 4.4 years
Nordson Corporation’s management team has an average tenure of 3.3 years. It is considered experienced.
Business Overview
Nordson Corporation is a diversified precision technology company that engineers, manufactures and markets differentiated products and systems used to dispense, apply and control adhesives and other fluids, to test and inspect for quality, and to treat and cure surfaces.
The company's technology is used in diverse manufacturing facilities for consumer durable, consumer non-durable, medical, and technology markets, serving a broad customer base across various industries and regions.
Nordson has three operating segments: Industrial Precision Solutions, Medical and Fluid Solutions, and Advanced Technology Solutions.
Industrial Precision Solutions
This segment delivers dispensing and material processing technology, as well as measurement, inspection, and control solutions.
The company uses its technology to manage polymer processing, food inspection, tubing and film measurement, and the dispensing of adhesives and coatings. It primarily serves the consumer durables, non-durables, agriculture, and industrial markets.
Key product line includes:
-
Industrial Coatings – These are dispensing systems for various materials, along with UV equipment mainly used for curing and drying. Nordson focuses on markets like beverage containers, food cans, electric batteries, appliances, automotive, construction, and medical industries.
-
Measurement and Control Solutions – These are precise measurement tools like sensors, gauges, and analyzers. These tools guarantee quality and reliability in manufacturing for consumer goods, film processing, cable and tubing industries, and energy storage.
-
Packaging – There are automated adhesive dispensing systems for industries that rigidly package goods. Their focus markets are food and beverage packaging, pharmaceuticals, and other consumer goods packaging.
Medical and Fluid Solutions
This segment includes fluid management solutions for medical, high-tech industrial and other diverse end markets.
-
Medical – These are components for minimally invasive medical device delivery like cannulas, catheters, and medical balloons. They also produce single-use plastic parts for various medical applications such as biopharmaceuticals, patient care, surgery, and diagnostics.
-
Fluid Management – These are precise manual and semi-automated dispensers, along with specialized single-use plastic syringes, cartridges, tips, and fluid connection parts. These are crucial for applying and managing the flow of adhesives, sealants, and lubricants.
Advanced Technology Solutions
This segment integrates Nordson product technologies into different stages of a customer's production, focusing on surface treatment, precise material dispensing, and thorough quality checks before and after dispensing. Its focus is on serving customers in the electronics industry.
-
Electronics Systems – The company offers automated dispensing systems for the precise application of various fluids used for attachment, protection, and coating, alongside gas plasma treatment systems for surface cleaning before application. Their primary markets cover the entire electronics manufacturing supply chain, including semiconductor production, printed circuit board assemblies, and electronic component manufacturing.
-
Test and Inspection – They supply bond testing and automated inspection systems like optical, acoustic microscopy, and x-ray tools for the semiconductor and printed circuit board industries.
Nordson globally markets its products using a direct sales force, and qualified distributors, facilitated through direct operations spanning over 35 countries. In 2023, no single customer accounted for 10% or more of sales.

Nordson Corporation Reportable Segment Revenue FY2022. Source: Gurufocus
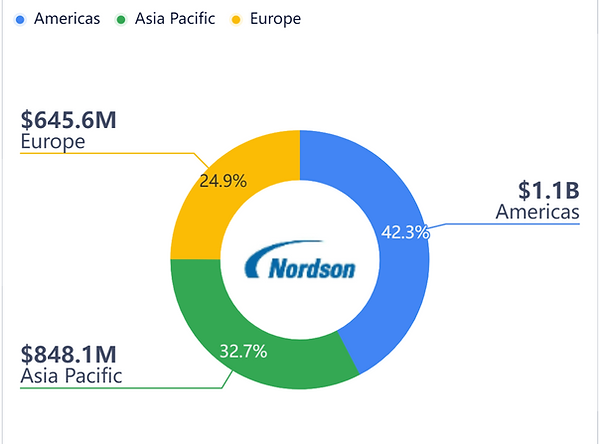
Nordson Corporation Revenue Geographic Breakdown FY2022. Source: Gurufocus
Trends, Competition, and Strategy Overview
Nordson’s strategy for long-term growth is based on solving customers’ needs globally.
In 2021, the company launched the Ascend strategy, which is designed to deliver revenue growth with leading margins and returns.
Ascend is driven by three interconnected pillars: the NBS ("Nordson Business System") Next growth framework; Owner Mindset, its division-led organizational structure; and Winning Teams, its talent strategy.
The NBS Next growth framework uses data-based segmentation to identify Nordson’s greatest opportunities for profitable growth so that it can invest its resources disproportionately in those areas.
The company grows organically by innovating products and technology, offering top-tier service, tapping into emerging markets, and adapting technology for new uses.
Additional growth stems from acquiring companies with differentiated precision technology-based products, serving high-growth end-market applications, and adopting a customer-focused approach. Its acquisition strategy aims to enhance its existing strengths, diversify into new industries, attract new customers, and broaden the range of solutions.
On 24 August 2023, Nordson finalized the acquisition of ARAG Group and its subsidiaries. ARAG specializes in precision control systems and smart fluid components for agricultural spraying.
Nordson excels during periods of change, benefiting from market innovation that fuels the need for better solutions. Over time, the company is well-positioned to leverage positive long-term trends like the growing use of 5G and autonomous vehicles. These trends are expected to open new avenues for its dispensing business.
Nordson operates in a competitive global marketplace and competes with many large, well-established manufacturers and service providers. The company’s equipment faces competition from various alternatives in bonding, sealing, finishing, coating, processing, testing, inspecting, and fluid control. Pricing, product quality and service also affect its competitive position.
To compete effectively, Nordson delivers high-quality, innovative products and technologies, accompanied by global service and technical support. They also collaborate with customers to understand their processes and develop application solutions that meet production requirements.
The company's extensive worldwide network of direct sales and technical resources further strengthens its competitive advantage.
Nordson Corporation Economic Moat
There are many ways to identify Nordson Corporation’s economic moat, but I focus on these 5 sources. The rating is purely subjective and is based on my in-depth understanding of the company.

Nordson Corporation Economic Moat
Economic Moat: Narrow
Nordson’s narrow economic moat is primarily based on high customer switching costs and intangible assets.
The company sets itself apart by producing mission-critical products for a customer's operations, despite constituting only a small part of the customer’s overall bill of material.
As Nordson's equipment holds a vital role in production, customers tend to stick with like-for-like replacements and are hesitant to switch vendors due to the risk of costly unscheduled downtime.
For instance, in the industrial precision solutions segment, Nordson's products are tightly integrated into manufacturing lines, making switching to competitors' equipment both expensive and potentially disruptive.
Their focus lies in delivering highly engineered, customizable solutions crucial to a customer's manufacturing process. By emphasizing this approach, Nordson aims to generate added value for clients, reducing the total cost of ownership through enhanced efficiency, reliability, decreased downtime, and minimized material wastage.
Nordson generates a robust revenue flow through recurring sales linked to its extensive installed base. More than half of its sales stem from aftermarket parts and consumables. Components like hoses, nozzles, and pumps require periodic replacement due to wear and tear, ensuring a consistent demand for aftermarket parts.
Each equipment sale not only expands Nordson's installed base but also contributes a dependable, high-margin cash flow from replacement parts and consumables, offering predictability.
Nordson also benefits from its intangible assets like its quality reputation, strong OEM relationships, engineering expertise, and extensive patent portfolio.
With an R&D investment of around 3% of sales, aligned with industry peers, Nordson aims to safeguard its competitive stance. Alongside R&D, Nordson historically pursues M&A to diversify its solutions and venture into related markets. This strategy has enabled Nordson to access niche markets and enhance its capabilities in handling speciality materials.
Nordson Corporation’s Performance
Ben’s quick performance checklist:
Has Nordson Corporation's revenue consistently grown year over year for the past 5 years? Yes.
Is the net income consistently increasing year over year for the past 5 years? Inconsistent.
Has the cash flow from operating activities shown consistent year-over-year growth for the past 5 years? Inconsistent.
Has the free cash flow remained positive for the past 5 years? Yes.
Is the gross margin % consistent or growing over the past 5 years? Yes, it is consistent at around 54%
Has the EPS shown growth over the past 5 years? Yes, it is trending upwards.
In 2023, global sales grew by 1.5% compared to 2022. The increase was mainly from acquisitions, up by 3.8%, partly offset by a 1.4% decrease in organic sales and a 0.9% drop due to unfavorable currency translation effects.
All segments experienced an increase in sales except for Medical and Fluid Solutions.
In 2023, sales for this segment totalled $660,316, marking a 4.3% drop from 2022 sales of $690,177. This decrease was due to a decline in organic sales and unfavorable currency effects. The decline in organic sales stemmed from reduced demand for medical fluid components and fluid solutions, partly balanced by strong performance in medical interventional.

Nordson Corporation Revenue, Net Income, Operating Cash Flow, and FCF (USD Million)
Has free cash flow per share increased over the last 5 years? Yes.

Nordson Corporation FCF per Share
Management Effectiveness
Has Nordson Corporation's ROE stayed within or above the 12%-15% range year over year for the past 5 years? Yes.

Nordson Corporation's Return on Equity
Has the ROIC stayed within or above the 12%-15% range year over year for the past 5 years? Yes.

Nordson Corporation Return on Invested Capital vs Weighted Average Cost of Capital
The trendline for the number of shares outstanding is flat.
Nordson uses cash from operations and proceeds from borrowings under credit facilities to fund the repurchase program. Approximately $551,996 of the total $1,500,000 authorized remained available for share repurchases on 31 October 2023. The repurchase program does not have an expiration date.
The company uses the repurchased shares for funding of benefit programs including stock options and restricted stock.

Nordson Corporation Shares Outstanding (Million Shares)
Nordson Corporation Financial Health

Nordson Corporation Financial Health (USD Million)
Current Ratio: 2.1 (pass my requirement of >1.0)
Debt-to-EBITDA: 2.4 (pass my requirement of <3.0)
Interest Coverage: 11.3 (pass my requirement of >3.0)
Debt Servicing Ratio: 8.9% (pass my requirement of <30.0%)
Nordson Corporation Stock Performance
The following graph compares the 10-year cumulative return, calculated on a dividend-reinvested basis, from investing $100 on 1 November 2013 in Nordson common shares, the S&P 500 Index, the S&P MidCap 400 Index, the S&P 500 Industrial Machinery Index, the S&P MidCap 400 Industrial Machinery Index and its New Peer Group, which includes: AME, B, DCI, ENTG, GGG, GTLS, ICUI, IEX, ITT, KEYS, LECO, MKSI, NATI, TER, TFX, TRMB, VNT, WTS and WWD.
For 2023, the company made changes to its peer group to add ICU Medical, Inc., Teleflex Incorporated and Vontier Corporation, because each had fallen inside of the parameters used to establish the peer group.
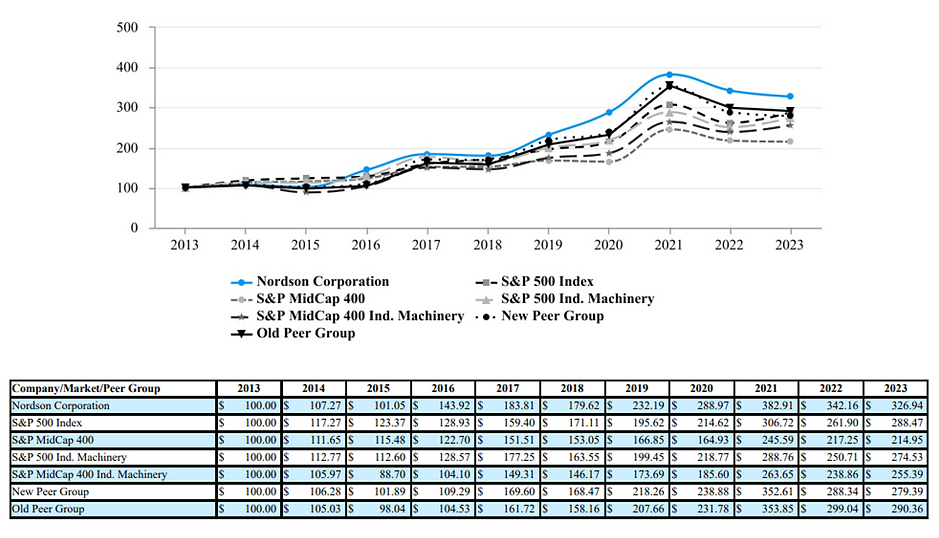
Stock Performance. Source: Nordson Corporation 10K
Nordson Corporation Intrinsic Valuation
Estimated intrinsic value: USD $149.45
Value is calculated using the discounted cash flow method (considering their cash and debt) and scenario planning.
Average free cash flow used: USD $510M
Projected growth rate: 7% - 10%
Beta: 1.0
Discount rate: 8.0%
Ideal margin of safety: 35% (Uncertainty: Mid)
Price range after the margin of safety: <USD $
Date of calculation: 5 Jan 24

Nordson Corporation Valuation
I use the past 5 years' free cash flow and apply a weighted average, giving more focus on the recent years. I then round the average to the nearest tens. In some instances, I use a more realistic number to represent the free cash flow.
The total debt and cash and short-term investments are the last quarter figures that are rounded to the nearest tens. In some instances, I use more realistic numbers to represent them.

Nordson Corporation Intrinsic Valuation
Nordson Corporation Relative Valuation

Nordson Corporation's Price-Earnings Ratio vs its peers

Nordson Corporation Historical Price-Earnings Ratio
Additional Resources
I recommend reading University of Berkshire Hathaway as it greatly helps in my stock analysis. If you want a complete collection of recommended books, please visit here.
My Concerns
In 2023, approximately 34% of Nordson's revenue originated in the United States, with the remaining 66% generated outside the country. Global economic challenges, including the impact of COVID-19 and regional conflicts in Europe and the Middle East, have disrupted financial markets, and introduced considerable volatility.
Nordson's revenue streams are notably influenced by various sectors, such as industrial, medical, electronics, and automotive industries. A slowdown in any of these sectors may directly affect profitability. Moreover, the company's sales are tied to industries historically sensitive to economic fluctuations.
Any sustained economic downturn or adverse market events, including recessions or inflation, could hurt the company's financial performance.
Nordson's historical and expected future growth relies in part on its acquisition strategy and the successful integration of acquired businesses into existing operations. But there are risks involved.
The company faces uncertainties about its ability to find suitable acquisitions, negotiate favorable terms, secure necessary financing, and smoothly integrate acquired businesses.
Integrated acquisitions, like the ARAG Group, may also pose a risk of underperformance. There will be challenges like meeting expected efficiencies and keeping key personnel. Furthermore, acquisitions may burden the company with acquisition-related debt and tax liabilities.
These uncertainties make it challenging to predict the outcomes and potential impacts of acquisitions.
Investing in Nordson demands careful consideration. While the company boasts a narrow economic moat due to its substantial installed base and recurring revenue from aftermarket parts, recent performance might be deemed unsatisfactory. However, Nordson's strong capital allocation strategies and a healthy balance sheet should provide a sense of reliability.
Nonetheless, prudent investors may seek an ideal margin of safety of 35% before considering entry into Nordson. This cautious approach accounts for potential risks and ensures a buffer against any unknown uncertainties.
Share this fundamental analysis
Please help us report any inaccurate information here. Thank you.