


Netflix, Inc. Fundamental Analysis
Disclaimer: This article by The Globetrotting Investor is general in nature. We aim to bring you long-term focused analysis driven by fundamental data, hence, providing you commentary based on historical data and analyst forecasts only using an unbiased methodology. This is not a buy/ sell recommendation, and it is solely for educational purposes. Please do your research before investing. Note that our analysis may not factor in the latest price-sensitive company announcements or qualitative material. Please read the full disclaimer here.
Netflix, Inc.
Last Updated: 30 Aug 2023
NASDAQ: NFLX
GICS Sector: Communication Services
Sub-Industry: Entertainment

Share this fundamental analysis


Table of Contents
You can download a summary of Netflix, Inc.'s fundamental analysis in PDF here.
Management
CEO: Ted Sarandos
Tenure: 3.1 years
Netflix, Inc.'s management team has an average tenure of 4.3 years. It is considered experienced.
Source of Revenue
Netflix, Inc. provides entertainment services. It offers TV series, documentaries, feature films, and mobile games across various genres and languages. The company provides members the ability to receive streaming content through a host of internet-connected devices, including TVs, digital video players, television set-top boxes, and mobile devices.
Its core strategy revolves around the global expansion of its business operations, all while adhering to the set operating margin target. A key focal point lies in the continual enhancement of the members' experience through the provision of compelling content that delights them and attracts new members.
A concerted effort is made to foster organic conversations surrounding the content, thereby elevating the overall satisfaction of members. This is complemented by a continuous refinement of the user interface to facilitate a more streamlined content selection process, catering to members' preferences for an enjoyable viewing experience.
Operating as a singular operating segment, the company derives its primary revenue stream from the monthly membership fees for services related to streaming content to our members.
Netflix’s pattern of membership growth demonstrates seasonality, tied to the variability of consumer acquisitions of internet-connected screens and corresponding spikes in content consumption. Notably, historical data shows that the fourth quarter typically registers the most significant upsurge in streaming memberships. It is worth noting that the trajectory of membership growth is susceptible to variables such as the cadence of content releases and shifts in pricing strategies.
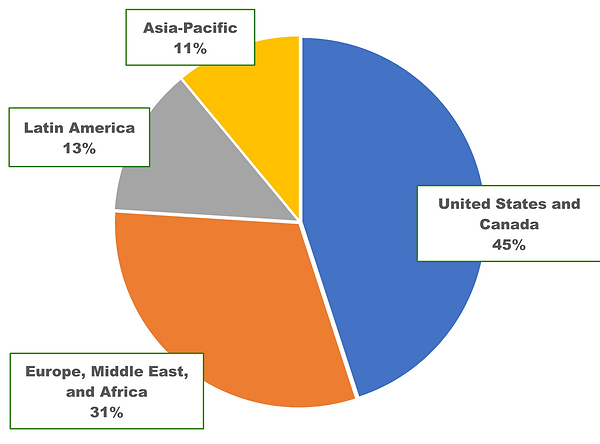
Netflix, Inc. Revenue Geographic Breakdown FY2022
Netflix, Inc. Economic Moat

Netflix, Inc. Economic Moat
Economic Moat: Narrow
There are many ways to identify Netflix’s economic moat, but I focus on the above 5 types. The rating is purely subjective and based on my in-depth understanding and analysis of Netflix. Please check my summary to understand more about the economic moat.
Performance Checklist
Is Netflix’s revenue growing YoY for the past 5 years consistently? Yes.
Is the net income growing YoY for the past 5 years consistently? Inconsistent.
Is the cash flow from operating activities growing YoY for the past 5 years consistently? No.
Is the free cash flow positive for the past 5 years? No.
Is the gross margin % consistent/ growing for the past 5 years? Yes.
Is the EPS growing for the past 5 years? Inconsistent.

Netflix, Inc. Revenue, Net Income, Operating Cash Flow, and FCF (USD Million)
Is the free cash flow per share growing for the past 5 years? No.
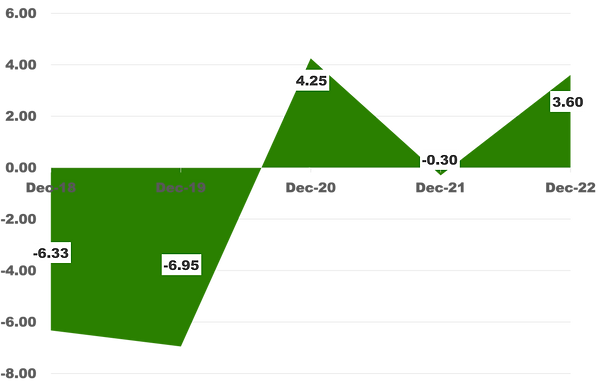
Netflix, Inc. FCF per Share
Management Effectiveness
Is Netflix, Inc.’s ROE consistently at 12%-15% YoY for the past 5 years? Yes.

Netflix, Inc. Return on Equity
Is the ROIC consistently at 12%-15% YoY for the past 5 years? No.

Netflix, Inc. Return on Invested Capital vs Weighted Average Cost of Capital
The trendline for the number of shares outstanding is increasing, which is something that an investor would not be pleased to see.

Netflix, Inc. Shares Outstanding (Million Shares)
Netflix, Inc. Financial Health

Netflix, Inc. Financial Health (USD Million)
Current Ratio: 1.3 (pass my requirement of >1.0)
Debt-to-EBITDA: 0.8 (pass my requirement of <3.0)
Interest Coverage: 7.4 (pass my requirement of >3.0)
Debt Servicing Ratio: 34.8% (fail my requirement of <30.0%)
Dividend
Netflix, Inc. does not have a record of paying a dividend.
Netflix, Inc. Intrinsic Valuation
Estimated intrinsic value: $93.99
Value is calculated using discounted cash flow method (taking into account their cash and debt) and scenario planning.
Average free cash flow used: USD$2,000M
Projected growth rate: 8% - 18%
Beta: 1.3
Discount rate: 9.5%
Margin of safety: 50% (Uncertainty: High)
Price range after the margin of safety: <$47.00
Date of calculation: 30 Aug 2023

Netflix, Inc. Valuation
Free cash flow used is a weighted average that is rounded to the nearest tens. In some instances, I used a more realistic number to represent the free cash flow.
Total debt and cash and short-term investments are last quarter figures that are rounded to the nearest tens. In some instances, I used more realistic numbers to represent them.

Netflix, Inc. Intrinsic Valuation
Netflix, Inc. Relative Valuation

Netflix, Inc. EV-to-EBITDA vs its peers

Netflix, Inc. Price-Earnings Ratio vs its peers

Netflix, Inc. Historical Price-Earnings Ratio
Additional Resources
I recommend reading University of Berkshire Hathaway as it greatly helps in my stock analysis. If you want a complete collection of recommended books, please visit here.
My Top Concern
The entertainment market is highly competitive and rapidly changing, with various ways for consumers to access entertainment videos, such as through subscriptions, transactions, ads, and piracy. Both traditional and internet-based providers are expanding their streaming video services, leveraging their resources and exclusive content. They might offer better content, pricing, and technology, while new entrants could introduce unique approaches. There is also a risk of piracy, which offers content for free and is growing quickly worldwide. Failing to compete effectively could harm Netflix’s business, leading to reduced market share, revenue, and profitability.
Netflix has also introduced an ad-supported subscription plan that generates revenue through digital advertising on its platform. However, Netflix's experience with advertising is limited, and the growth of its advertising revenue might not meet expectations. The success of Netflix's ad-supported plan and revenue generation depends on factors such as attracting and retaining advertisers, fluctuations in memberships and engagement, ad quality and quantity, effective competition for advertising budgets, potential adverse effects of ads on its image, the impact of its content and reputation on advertisers, and the possibility of member dissatisfaction due to ads.
Summary for Netflix, Inc.
Netflix, the largest subscription video-on-demand provider in the United States, is undergoing global expansion. With a staggering count of over 130 million subscribers worldwide, the platform utilizes its data to enhance content selection. It continually invests in technology to optimise streaming quality, device compatibility, and user interfaces. This dual approach maintains the satisfaction of current viewers and attracts new ones through personalized recommendations and accolades. As a result, Netflix sets a high benchmark, making it difficult for potential competitors to match its performance.
One of the most prominent sources of Netflix's economic moat lies in its intangible assets, primarily derived from its expansive content library and original productions. This library encompasses a wide array of movies, TV shows, documentaries, and unique programming. The popularity of original series like "Stranger Things" and "House of Cards" has cultivated a dedicated fan base, effectively differentiating Netflix from its rivals.
Through streaming technology, Netflix meticulously monitors user interactions, encompassing both significant actions and minor nuances such as viewing duration and fast-forwarding. This data undergoes analysis to enrich the service, gain insights into user behaviour, and identify popular content. While competitors like Amazon might adopt similar approaches, Netflix's larger subscriber base and extensive usage give its data a distinct advantage.
The utilization of its data sets Netflix ahead in various aspects. They scrutinize data flow, video quality, and buffering to rectify technical glitches. Additionally, they delve into user behaviour and device preferences to refine user interfaces. This real-time data-driven approach enables rapid improvements compared to conventional testing methods. With a diverse subscriber base employing a range of devices across various countries, Netflix possesses an extensive and expanding dataset of unparalleled quality that its rivals struggle to emulate.
Netflix leverages its cloud-stored data to curate content and provide recommendations. Rather than relying solely on ratings, they analyze how subscribers engage with content to inform their selections. Recommendations draw from viewers' past choices and preferences of similar users. As Netflix grows, it employs this data to create exclusive content tailored to user preferences, setting it apart from mere competition with content creators.
This recommendation algorithm serves as a prime example of how data-powered personalisation creates a moat for Netflix's competitors.
Regarding switching costs, it can be argued that Netflix's switching cost is relatively low. Subscribers can easily cancel their Netflix subscription and migrate to another streaming service. With no contractual obligations or early termination fees, users retain the flexibility to discontinue their subscriptions at any time.
However, certain factors could elevate the switching cost for Netflix. For instance, subscribers who have invested substantial time in curating their watchlist or have a plethora of favourite shows exclusively available on Netflix may be less inclined to switch services.
Assessing whether Netflix enjoys a cost advantage necessitates an evaluation of factors such as content, marketing, and technology expenditures. Netflix allocates significant resources to content, spanning both original and licensed material, with its expansive subscriber base aiding in cost distribution. Although marketing expenses are notable, they are required for attracting and retaining subscribers. The extensive technological infrastructure that underpins content delivery and user data management contributes to overall costs. Gauging Netflix's cost advantage is complex due to these multifaceted factors. While its large subscriber base and strong brand offer benefits such as favourable content deals and targeted marketing, challenges like rising content, marketing, and technology costs counter this advantage.
In conclusion, Netflix exhibits narrow moat attributes due to its data-driven personalization, diverse content library, and global presence. These strengths create a robust competitive advantage, setting Netflix apart in the streaming market.
Over the past five years, Netflix has exhibited a noteworthy performance trajectory. Its revenue has displayed consistent growth year over year, a testament to its ability to attract and retain a vast subscriber base. However, the same cannot be said for the net income, which has shown an inconsistent pattern of YoY growth, indicating that while the company's top line is expanding, its bottom-line profitability has experienced fluctuations. Moreover, the cash flow from operating activities has not demonstrated consistent YoY growth, reflecting challenges in managing operational cash generation. The company's free cash flow also remains in negative territory, indicating substantial investments in content creation and expansion.
Netflix's approach to capital allocation over the past five years has been interesting. While its ROE has demonstrated remarkable consistency, ranging from 12% to 15% YoY, the company has managed to outshine its industry peers in this aspect. This showcases Netflix's adeptness at generating healthy returns for its shareholders. However, the same cannot be said for its ROIC, which has not exhibited the same level of stability in the specified range, suggesting fluctuations in its ability to efficiently deploy capital for profitable growth. Notably, Netflix's ROIC has fallen short of its WACC, indicating that the company is struggling to generate returns that exceed its cost of capital. A concerning note for investors arises from the trend of increasing shares outstanding. This suggests that the company is diluting existing shareholder ownership through equity financing.
Netflix's financial health stands on a solid foundation, evident from several key metrics. The current ratio of 1.3 surpasses the desired benchmark of 1.0, indicating the company's capability to cover short-term obligations with its current assets. Moreover, the debt-to-EBITDA ratio of 0.8 signifies a manageable level of debt in relation to its earnings capacity. Notably, the debt-to-equity ratio has demonstrated a consistent reduction over the past five years, attaining a level that is deemed satisfactory, reflecting the company's prudent efforts in leveraging its operations. With an interest coverage ratio of 7.4, Netflix effectively exceeds the stipulated threshold of 3.0, portraying its ability to meet interest obligations from its earnings. However, a slight concern emerges from the debt servicing ratio of 34.8%, which falls short of the preferred level of below 30.0%. This suggests that a significant portion of the company's earnings is allocated towards debt servicing, warranting further attention to ensure a sustainable balance between debt obligations and financial stability.
Investing in Netflix presents a complex decision landscape. While the company boasts a narrow economic moat, suggesting it possesses certain competitive advantages, other aspects raise concerns. The track record of performance, capital allocation, and balance sheet metrics has been unsatisfactory, pointing to potential challenges in its financial management. As a result, considering an investment in this company involves a notable degree of uncertainty. To mitigate this risk, a cautious approach is warranted, demanding a high margin of safety of at least 50%. This margin would provide a buffer against the uncertainties surrounding Netflix's operational strategies, ensuring that potential gains outweigh the potential downsides associated with investing in a company with mixed indicators of stability and growth.
Share this fundamental analysis
Please help us report any inaccurate information here. Thank you.