Is VIX the crystal ball that we are finding?
- Feb 26, 2024
- 2 min read
Updated: Apr 9, 2024
With the ongoing market volatility, you may have come across the term “VIX.”
What is VIX and is this indicator useful for investors?
The VIX, or Chicago Board Options Exchange (CBOE) Volatility Index, is a gauge of the anticipated volatility of the U.S. stock market.
It is an index that reflects the market's expectations of near-term fluctuations in the S&P 500 index and is updated in real-time.
It is important to understand that although volatility can be associated with negative implications, such as increased risk, uncertainty, or market declines, it is a neutral term.
Yes, it is simply a neutral term.
Volatility is merely a statistical calculation of price fluctuations for an index or security. Greater volatility shows that the index or security is experiencing significant price fluctuations, either upward or downward, in shorter time frames.
Now that you understand what volatility actually means, let’s take a look at how we measure it.
The first approach involves historical volatility and requires statistical computations on past prices within a particular timeframe. This involves calculating different statistical values, such as mean, variance, and standard deviation, based on the historical price data sets.
The second approach, which the VIX uses, involves examining options prices.
The VIX is a forward-looking index based on how much investors are willing to pay for options. The index is created based on the implied volatilities of S&P 500 index options, indicating the market's prediction of future volatility over a 30-day period for the S&P 500 index.
An increase in option prices suggests increased market uncertainty and higher expected volatility, which lead to a rise in the VIX.
Enough of the methodology, so, what does VIX tell us as investors?
Well, we often refer to it as the market's ‘fear gauge.’ If there is a surge in the VIX, it implies that there is more ‘fear and panic’ in the market as it expects a rise in market volatility.
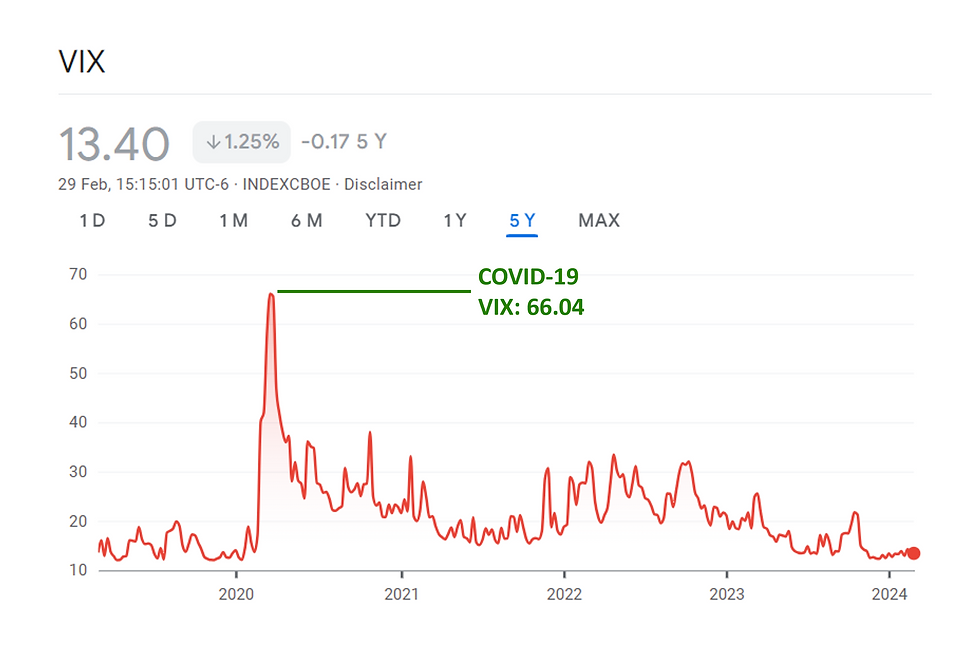
A VIX reading of above 30 widely suggests that there is a high level of uncertainty, risk, and fear. However, VIX levels are high for only brief periods during times of crisis and are not sustained for long.
The highest point the VIX has ever reached at 89.53 was on 24 October 2008, at the height of the financial crisis.
A reading around 20 generally suggests a more stable market.
I hope I can find the crystal ball for you. It will make our lives as investors easier!
Unfortunately, VIX is only a theoretical measure of volatility and is not our crystal ball.
It does not predict the future performance of the stock market and it has been proven wrong about the future direction of the market before.
That is why it is best to stick to your investing fundamentals instead of looking for shortcuts and timing the market.


Comments